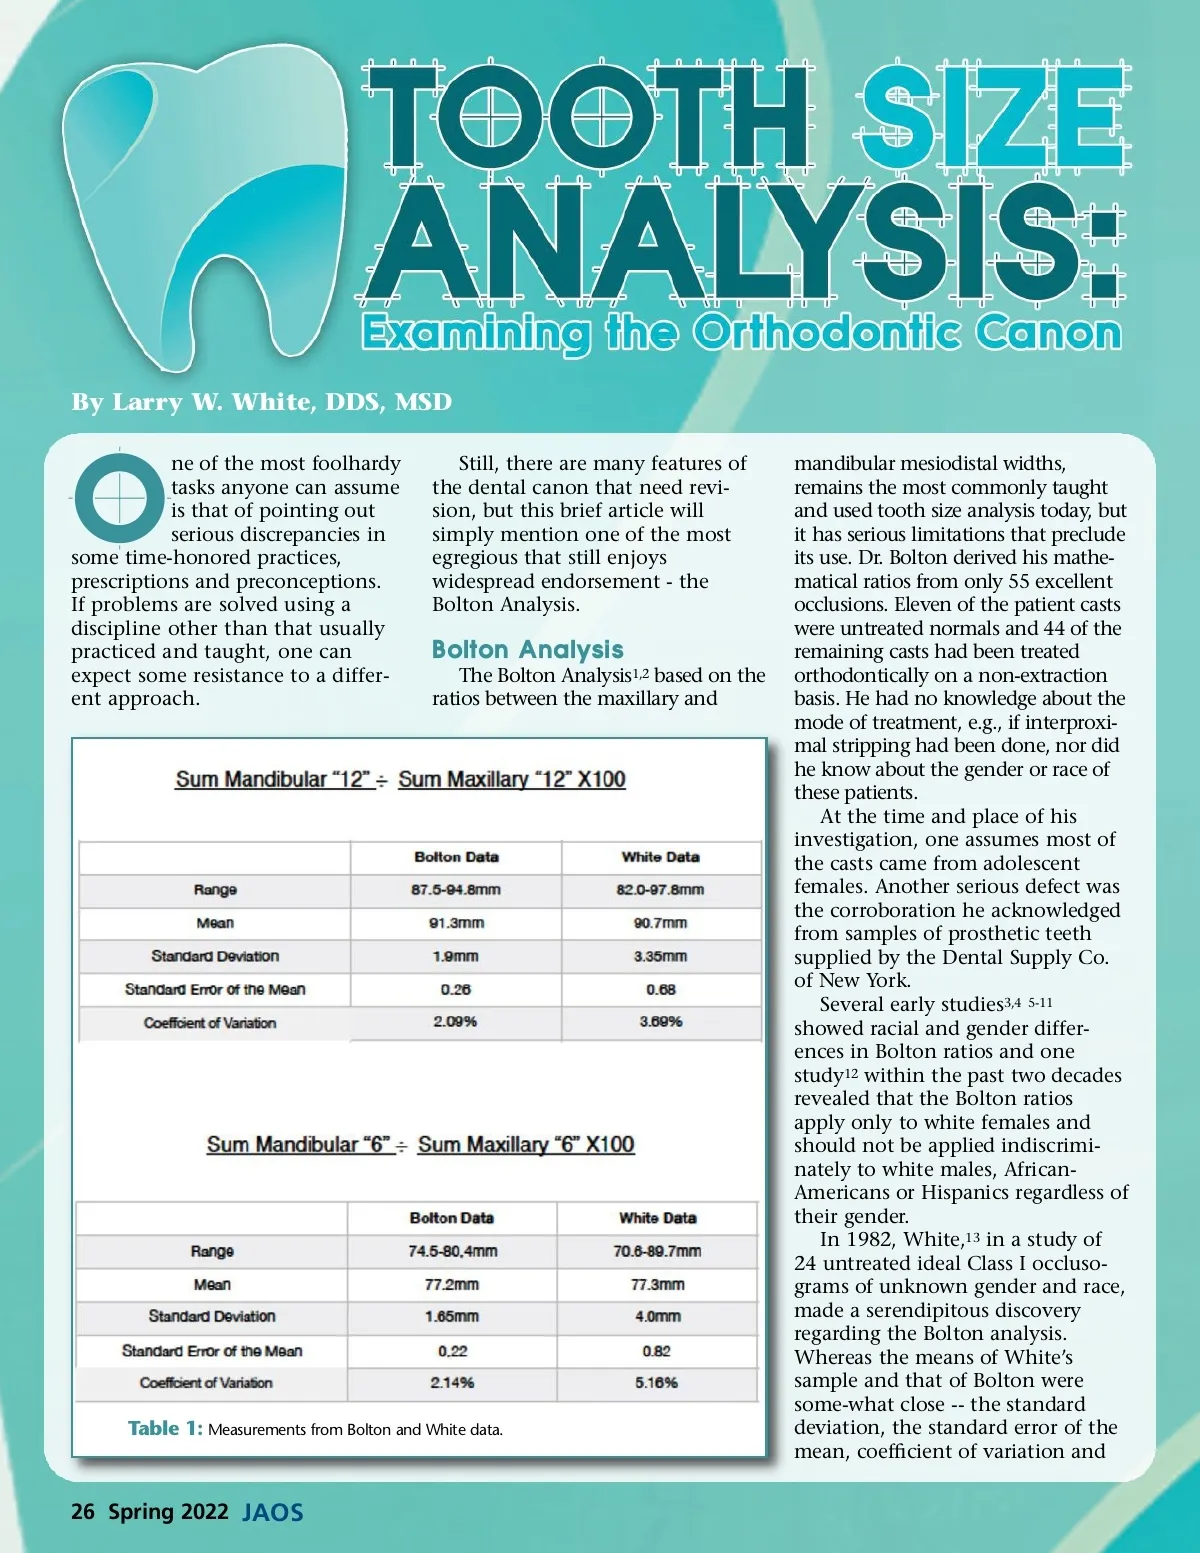
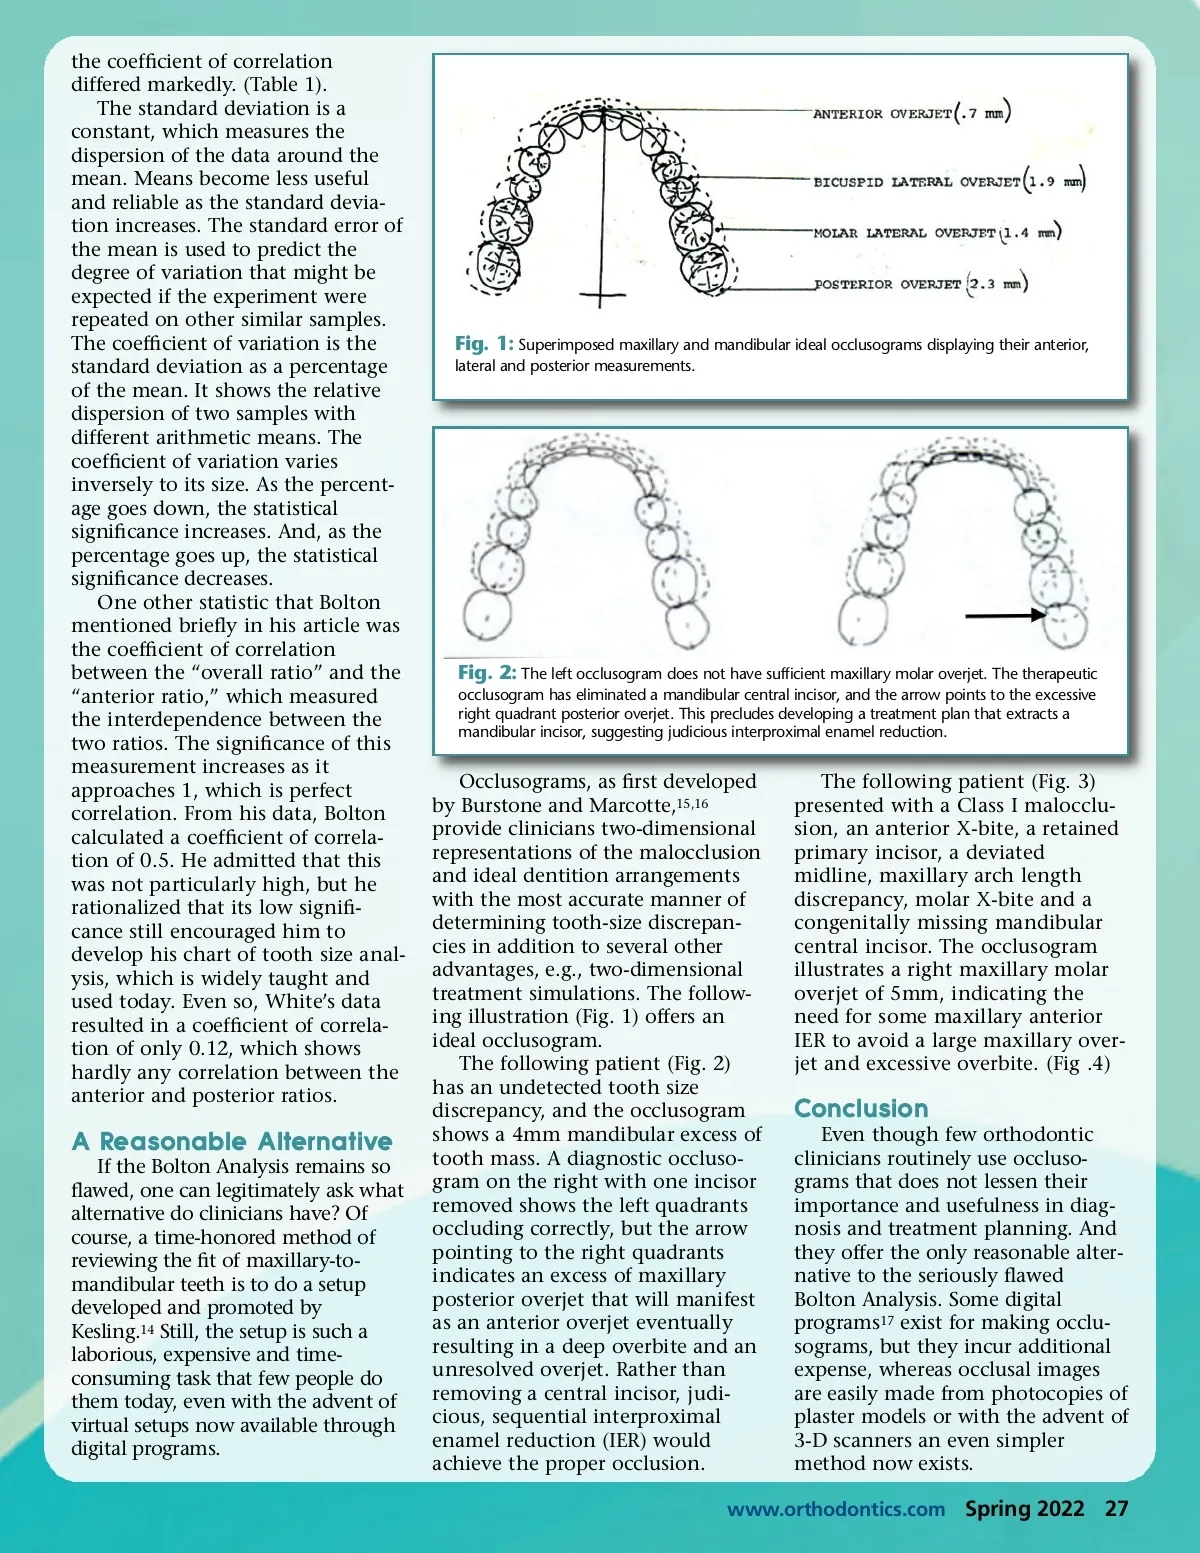
the coefficient of correlation differed markedly. (Table 1). The standard deviation is a constant, which measures the dispersion of the data around the mean. Means become less useful and reliable as the standard devia-tion increases. The standard error of the mean is used to predict the degree of variation that might be expected if the experiment were repeated on other similar samples. The coefficient of variation is the standard deviation as a percentage of the mean. It shows the relative dispersion of two samples with different arithmetic means. The coefficient of variation varies inversely to its size. As the percent-age goes down, the statistical significance increases. And, as the percentage goes up, the statistical significance decreases. One other statistic that Bolton mentioned briefly in his article was the coefficient of correlation between the “overall ratio” and the “anterior ratio,” which measured the interdependence between the two ratios. The significance of this measurement increases as it approaches 1, which is perfect correlation. From his data, Bolton calculated a coefficient of correla-tion of 0.5. He admitted that this was not particularly high, but he rationalized that its low signifi-cance still encouraged him to develop his chart of tooth size anal-ysis, which is widely taught and used today. Even so, White’s data resulted in a coefficient of correla-tion of only 0.12, which shows hardly any correlation between the anterior and posterior ratios. Fig. 1: Superimposed maxillary and mandibular ideal occlusograms displaying their anterior, lateral and posterior measurements. Fig. 2: The left occlusogram does not have sufficient maxillary molar overjet. The therapeutic occlusogram has eliminated a mandibular central incisor, and the arrow points to the excessive right quadrant posterior overjet. This precludes developing a treatment plan that extracts a mandibular incisor, suggesting judicious interproximal enamel reduction. A Reasonable Alternative If the Bolton Analysis remains so flawed, one can legitimately ask what alternative do clinicians have? Of course, a time-honored method of reviewing the fit of maxillary-to-mandibular teeth is to do a setup developed and promoted by Kesling. 14 Still, the setup is such a laborious, expensive and time-consuming task that few people do them today, even with the advent of virtual setups now available through digital programs. Occlusograms, as first developed by Burstone and Marcotte, 15,16 provide clinicians two-dimensional representations of the malocclusion and ideal dentition arrangements with the most accurate manner of determining tooth-size discrepan-cies in addition to several other advantages, e.g., two-dimensional treatment simulations. The follow-ing illustration (Fig. 1) offers an ideal occlusogram. The following patient (Fig. 2) has an undetected tooth size discrepancy, and the occlusogram shows a 4mm mandibular excess of tooth mass. A diagnostic occluso-gram on the right with one incisor removed shows the left quadrants occluding correctly, but the arrow pointing to the right quadrants indicates an excess of maxillary posterior overjet that will manifest as an anterior overjet eventually resulting in a deep overbite and an unresolved overjet. Rather than removing a central incisor, judi-cious, sequential interproximal enamel reduction (IER) would achieve the proper occlusion. The following patient (Fig. 3) presented with a Class I malocclu-sion, an anterior X-bite, a retained primary incisor, a deviated midline, maxillary arch length discrepancy, molar X-bite and a congenitally missing mandibular central incisor. The occlusogram illustrates a right maxillary molar overjet of 5mm, indicating the need for some maxillary anterior IER to avoid a large maxillary over-jet and excessive overbite. (Fig .4) Conclusion Even though few orthodontic clinicians routinely use occluso-grams that does not lessen their importance and usefulness in diag-nosis and treatment planning. And they offer the only reasonable alter-native to the seriously flawed Bolton Analysis. Some digital programs 17 exist for making occlu-sograms, but they incur additional expense, whereas occlusal images are easily made from photocopies of plaster models or with the advent of 3-D scanners an even simpler method now exists. www.orthodontics.com Spring 2022 27
Journal of the American Orthodontic Society Spring 2022: Page 27