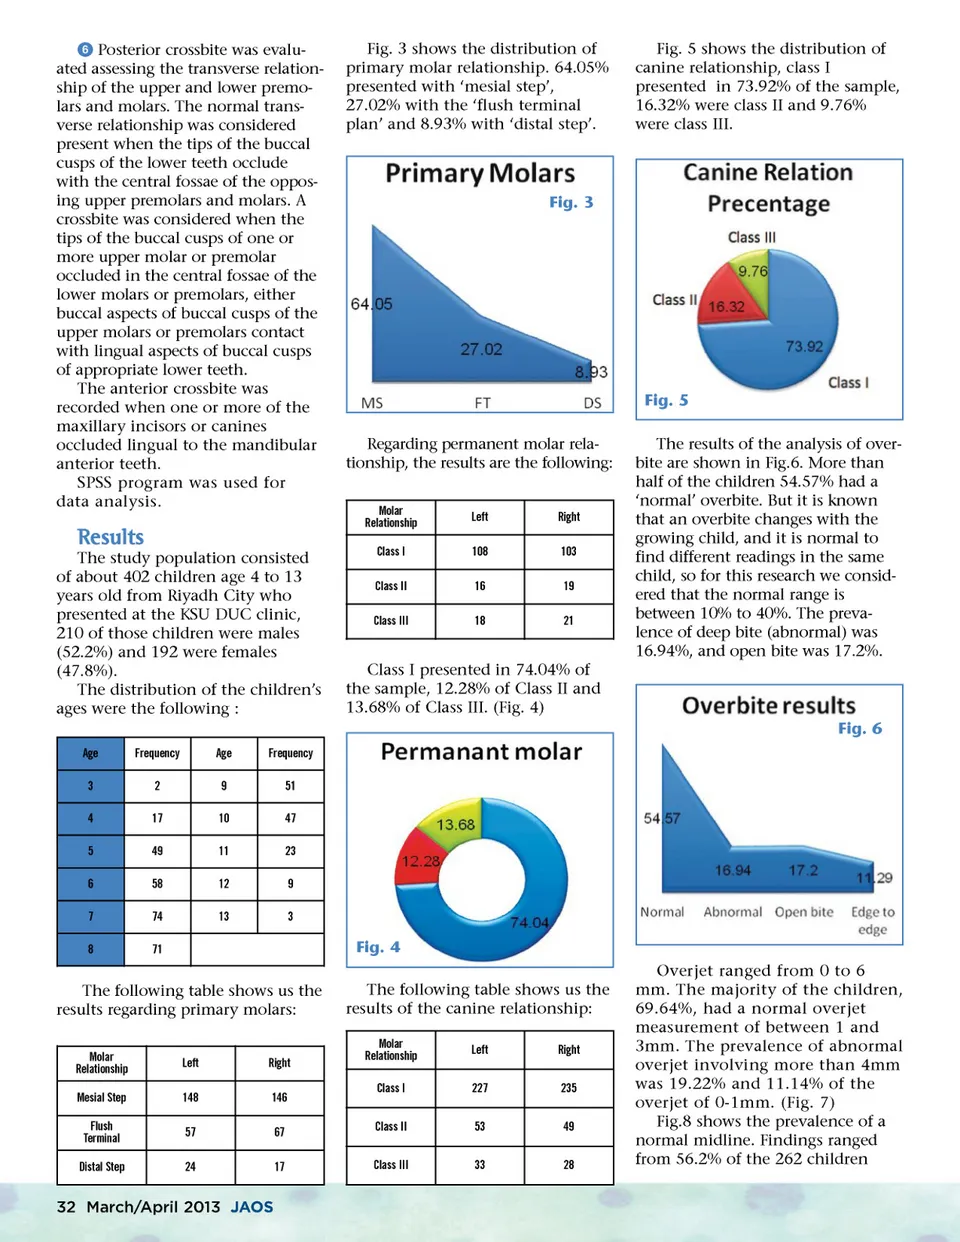
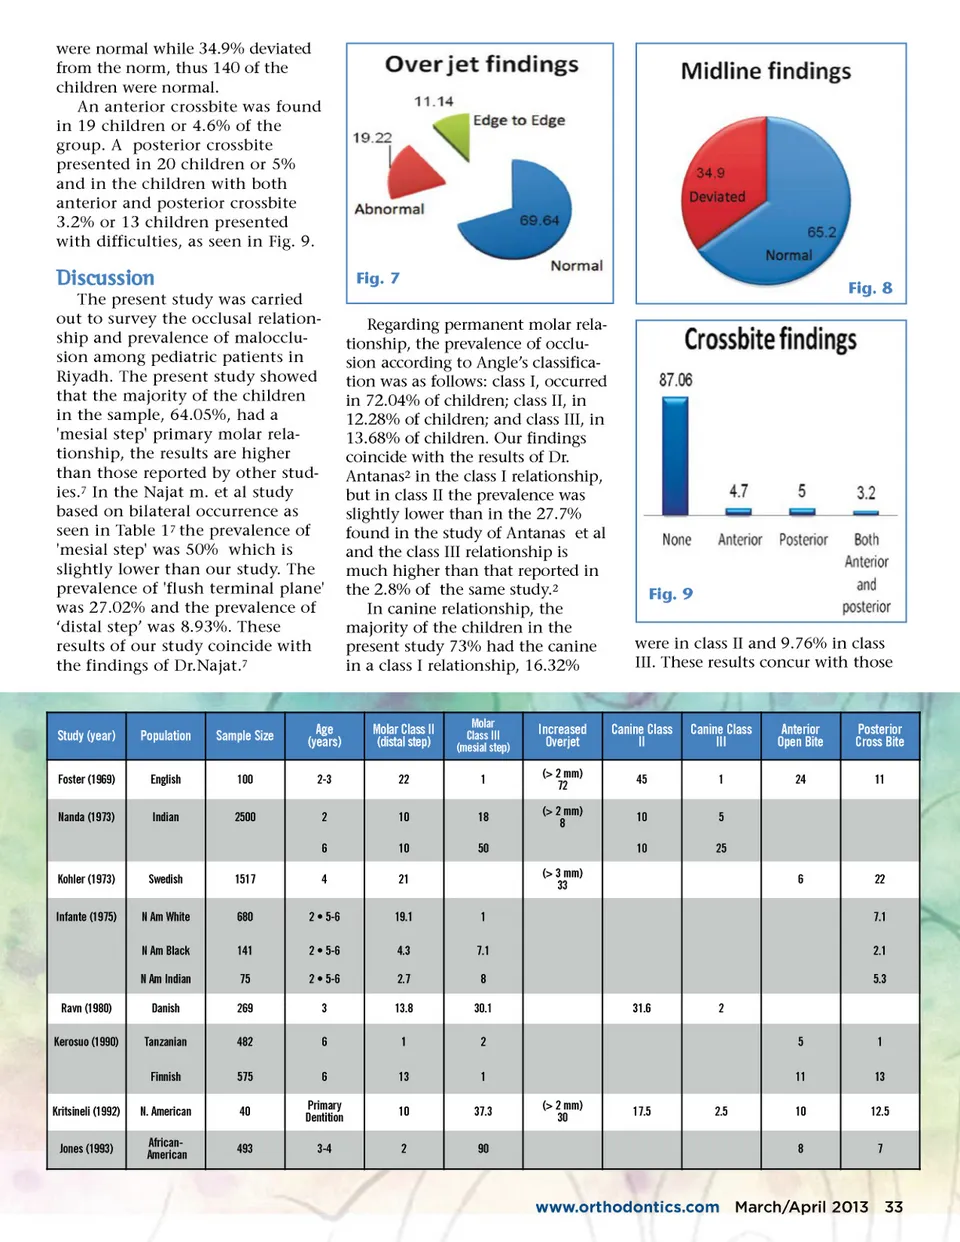
ᕦ Posterior crossbite was evalu-ated assessing the transverse relation-ship of the upper and lower premo-lars and molars. The normal trans-verse relationship was considered present when the tips of the buccal cusps of the lower teeth occlude with the central fossae of the oppos-ing upper premolars and molars. A crossbite was considered when the tips of the buccal cusps of one or more upper molar or premolar occluded in the central fossae of the lower molars or premolars, either buccal aspects of buccal cusps of the upper molars or premolars contact with lingual aspects of buccal cusps of appropriate lower teeth. The anterior crossbite was recorded when one or more of the maxillary incisors or canines occluded lingual to the mandibular anterior teeth. SPSS program was used for data analysis. Fig. 3 shows the distribution of primary molar relationship. 64.05% presented with ‘mesial step’, 27.02% with the ‘flush terminal plan’ and 8.93% with ‘distal step’. Fig. 5 shows the distribution of canine relationship, class I presented in 73.92% of the sample, 16.32% were class II and 9.76% were class III. Fig. 3 Fig. 5 Regarding permanent molar rela-tionship, the results are the following: Molar Relationship Class I Class II Class III Left 108 16 18 Right 103 19 21 Results The study population consisted of about 402 children age 4 to 13 years old from Riyadh City who presented at the KSU DUC clinic, 210 of those children were males (52.2%) and 192 were females (47.8%). The distribution of the children’s ages were the following : Age 3 4 5 6 7 8 Frequency 2 17 49 58 74 71 Age 9 10 11 12 13 Frequency 51 47 23 9 3 The results of the analysis of over-bite are shown in Fig.6. More than half of the children 54.57% had a ‘normal’ overbite. But it is known that an overbite changes with the growing child, and it is normal to find different readings in the same child, so for this research we consid-ered that the normal range is between 10% to 40%. The preva-lence of deep bite (abnormal) was 16.94%, and open bite was 17.2%. Class I presented in 74.04% of the sample, 12.28% of Class II and 13.68% of Class III. (Fig. 4) Fig. 6 Fig. 4 The following table shows us the results of the canine relationship: Molar Relationship Class I Class II Class III Left 227 53 33 Right 235 49 28 The following table shows us the results regarding primary molars: Molar Relationship Mesial Step Flush Terminal Distal Step Left 148 57 24 Right 146 67 17 Overjet ranged from 0 to 6 mm. The majority of the children, 69.64%, had a normal overjet measurement of between 1 and 3mm. The prevalence of abnormal overjet involving more than 4mm was 19.22% and 11.14% of the overjet of 0-1mm. (Fig. 7) Fig.8 shows the prevalence of a normal midline. Findings ranged from 56.2% of the 262 children 32 March/April 2013 JAOS
Journal of the American Orthodontic Society March-April 2013: Page 32