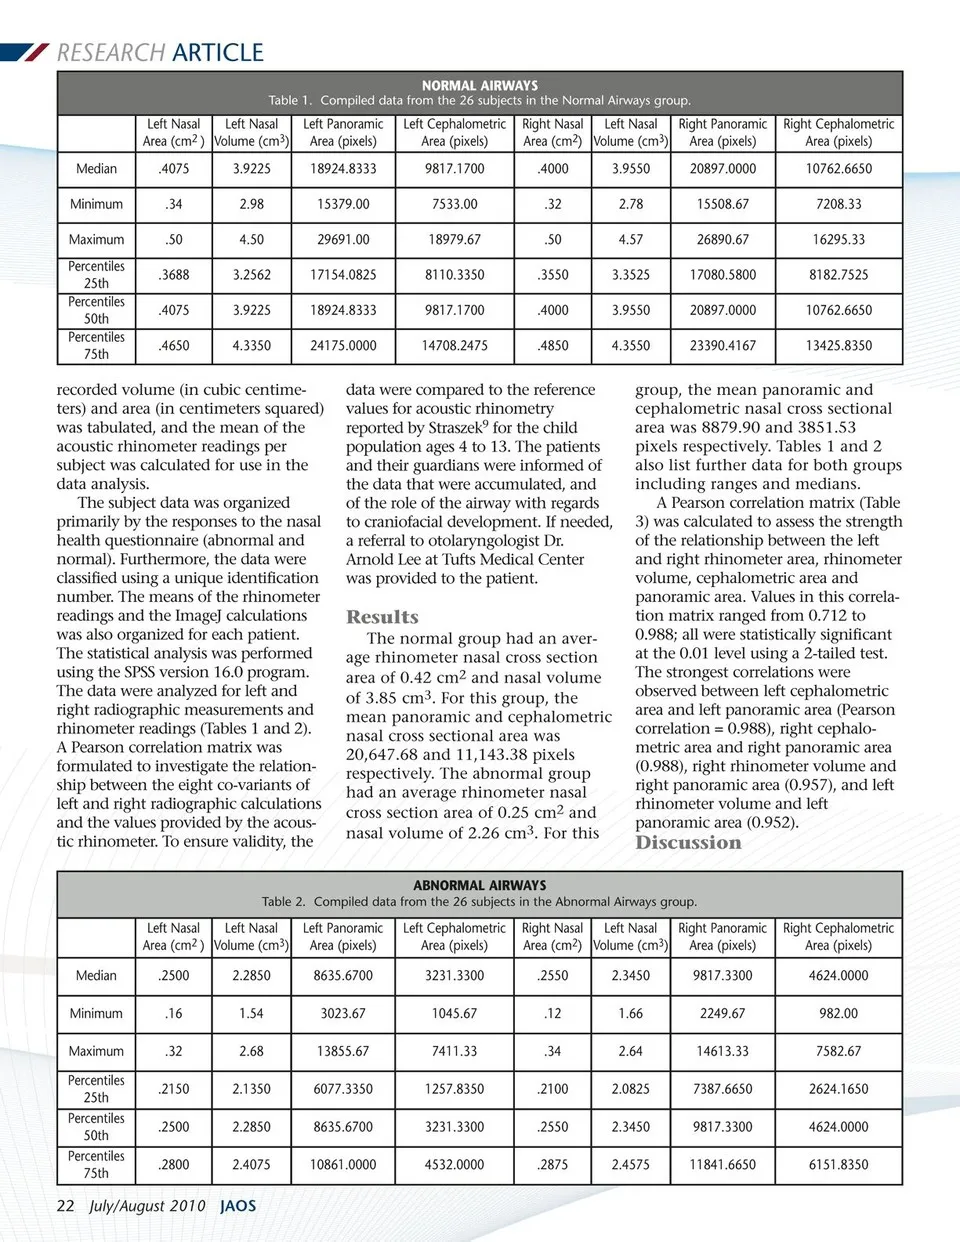
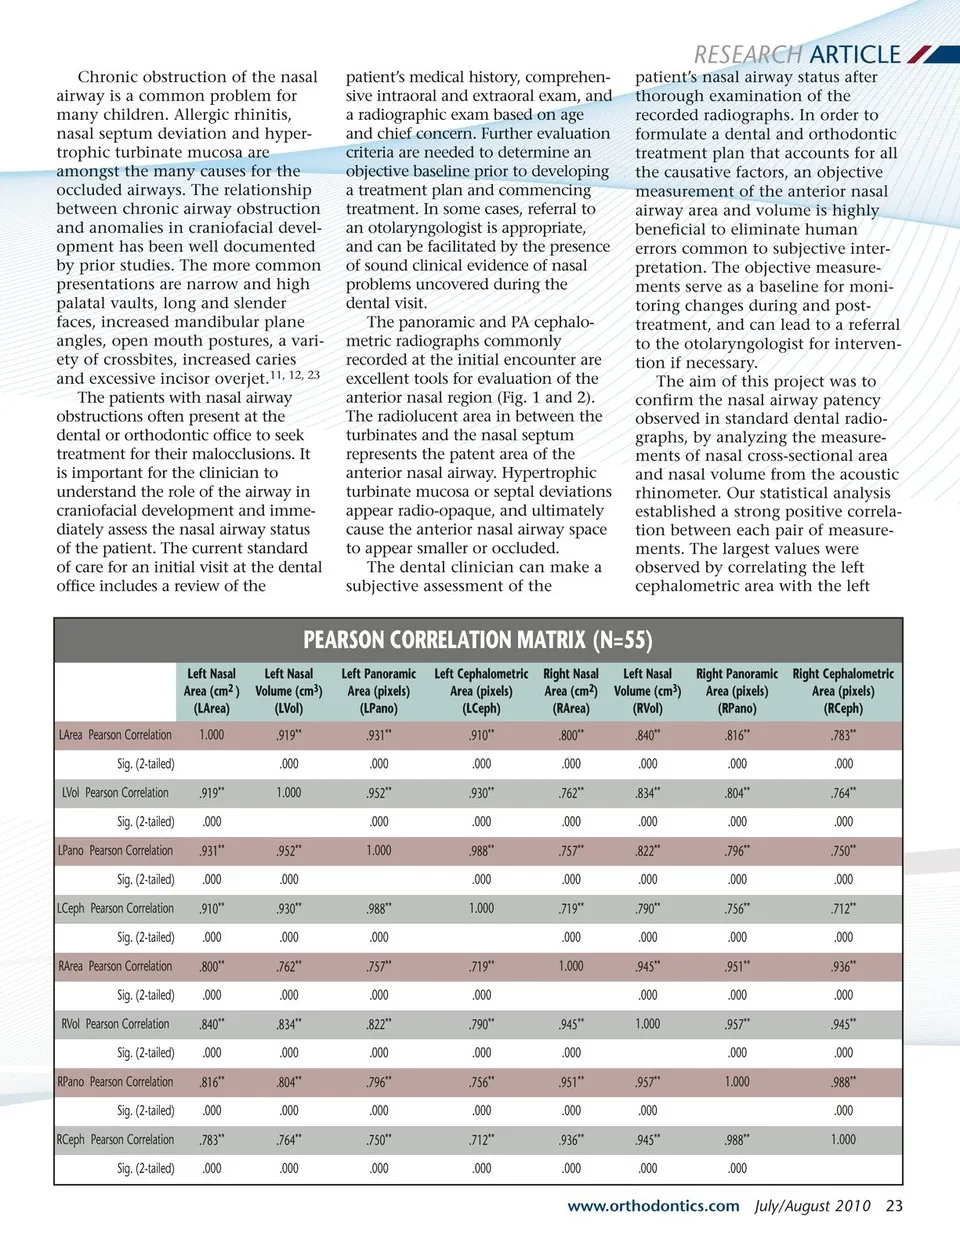
RESEARCH ARTICLE NORMAL AIRWAYS Left Nasal Area (cm2 ) Median Minimum Maximum Percentiles 25th Percentiles 50th Percentiles 75th .4075 .34 .50 .3688 .4075 .4650 Left Nasal Table 1. Compiled data from the 26 subjects in the Normal Airways group. Left Nasal Volume (cm3) 3.9225 2.98 4.50 3.2562 3.9225 4.3350 Left Panoramic Area (pixels) 18924.8333 15379.00 29691.00 17154.0825 18924.8333 24175.0000 recorded volume (in cubic centime-ters) and area (in centimeters squared) was tabulated, and the mean of the acoustic rhinometer readings per subject was calculated for use in the data analysis. The subject data was organized primarily by the responses to the nasal health questionnaire (abnormal and normal). Furthermore, the data were classified using a unique identification number. The means of the rhinometer readings and the ImageJ calculations was also organized for each patient. The statistical analysis was performed using the SPSS version 16.0 program. The data were analyzed for left and right radiographic measurements and rhinometer readings (Tables 1 and 2). A Pearson correlation matrix was formulated to investigate the relation-ship between the eight co-variants of left and right radiographic calculations and the values provided by the acous-tic rhinometer. To ensure validity, the Left Cephalometric Area (pixels) 9817.1700 7533.00 18979.67 8110.3350 9817.1700 14708.2475 Right Nasal Area (cm2) .4000 .32 .50 .3550 .4000 .4850 Volume (cm3) 3.9550 2.78 4.57 3.3525 3.9550 4.3550 data were compared to the reference values for acoustic rhinometry reported by Straszek9 for the child population ages 4 to 13. The patients and their guardians were informed of the data that were accumulated, and of the role of the airway with regards to craniofacial development. If needed, a referral to otolaryngologist Dr. Arnold Lee at Tufts Medical Center was provided to the patient. Results The normal group had an aver-age rhinometer nasal cross section area of 0.42 cm2 and nasal volume of 3.85 cm3. For this group, the mean panoramic and cephalometric nasal cross sectional area was 20,647.68 and 11,143.38 pixels respectively. The abnormal group had an average rhinometer nasal cross section area of 0.25 cm2 and nasal volume of 2.26 cm3. For this ABNORMAL AIRWAYS Left Nasal Area (cm2 ) Median Minimum Maximum Percentiles 25th Percentiles 50th Percentiles 75th .2500 .16 .32 .2150 .2500 .2800 Left Nasal Table 2. Compiled data from the 26 subjects in the Abnormal Airways group. Left Nasal Volume (cm3) 2.2850 1.54 2.68 2.1350 2.2850 2.4075 22 July/August 2010 JAOS Left Panoramic Area (pixels) 8635.6700 3023.67 13855.67 6077.3350 8635.6700 10861.0000 Left Cephalometric Area (pixels) 3231.3300 1045.67 7411.33 1257.8350 3231.3300 4532.0000 Right Nasal Area (cm2) .2550 .12 .34 .2100 .2550 .2875 Volume (cm3) 2.3450 1.66 2.64 2.0825 2.3450 2.4575 Right Panoramic Area (pixels) 9817.3300 2249.67 14613.33 7387.6650 9817.3300 11841.6650 Right Cephalometric Area (pixels) 4624.0000 982.00 7582.67 2624.1650 4624.0000 6151.8350 Right Panoramic Area (pixels) 20897.0000 15508.67 26890.67 17080.5800 20897.0000 23390.4167 Right Cephalometric Area (pixels) 10762.6650 7208.33 16295.33 8182.7525 10762.6650 13425.8350 group, the mean panoramic and cephalometric nasal cross sectional area was 8879.90 and 3851.53 pixels respectively. Tables 1 and 2 also list further data for both groups including ranges and medians. A Pearson correlation matrix (Table 3) was calculated to assess the strength of the relationship between the left and right rhinometer area, rhinometer volume, cephalometric area and panoramic area. Values in this correla-tion matrix ranged from 0.712 to 0.988; all were statistically significant at the 0.01 level using a 2-tailed test. The strongest correlations were observed between left cephalometric area and left panoramic area (Pearson correlation = 0.988), right cephalo-metric area and right panoramic area (0.988), right rhinometer volume and right panoramic area (0.957), and left rhinometer volume and left panoramic area (0.952). Discussion
Journal of the American Orthodontic Society July-August 2010/Buyer's Guide: Page 22